
Below are a selection of images and videos from our facility. If you have data acquired at the facility and want to show them off, please get in touch with a member of the CCI staff.
Please do not reproduce these images without prior permission from the CCI.
User Contributions
SRRF and TIRF
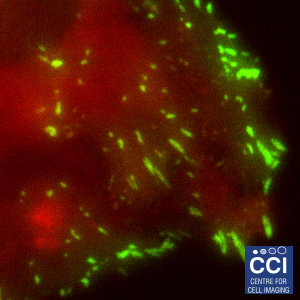
Focal adhesions are highly complex clusters of proteins and signalling molecules. Total Internal Reflection Fluorescence (TIRF) Microscopy drastically improves the image contrast as well as providing super resolution in the Z-plane. Here, TIRF images of DLC1 (red) and Talin (green) were imaged in TIRF mode using inline SRRF processing.
Images acquired on the Dragonfly. Sample provided by Rebecca Kelly (Sée Lab).
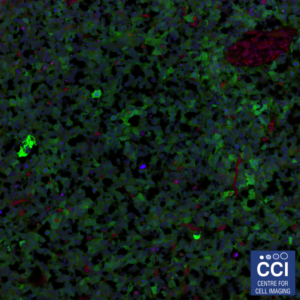
Tile scanning a hypoxic tumour
Tumours developed in a chick embryo model can be imaged at high resolution over a large area by tilescanning. In this case, 9 fields were imaged then stitched together to form a single field of view ~640μm squared. Implanted cells are shown in green, nuclei in blue and immunostaining for ZDHHC is shown in red.
Images acquired on the LSM 710 by Elysia Lindley and Anne Herrmann (Sée Lab).
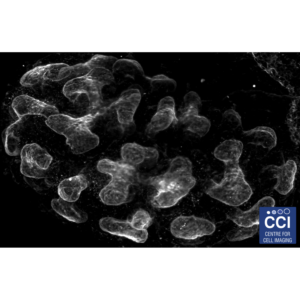
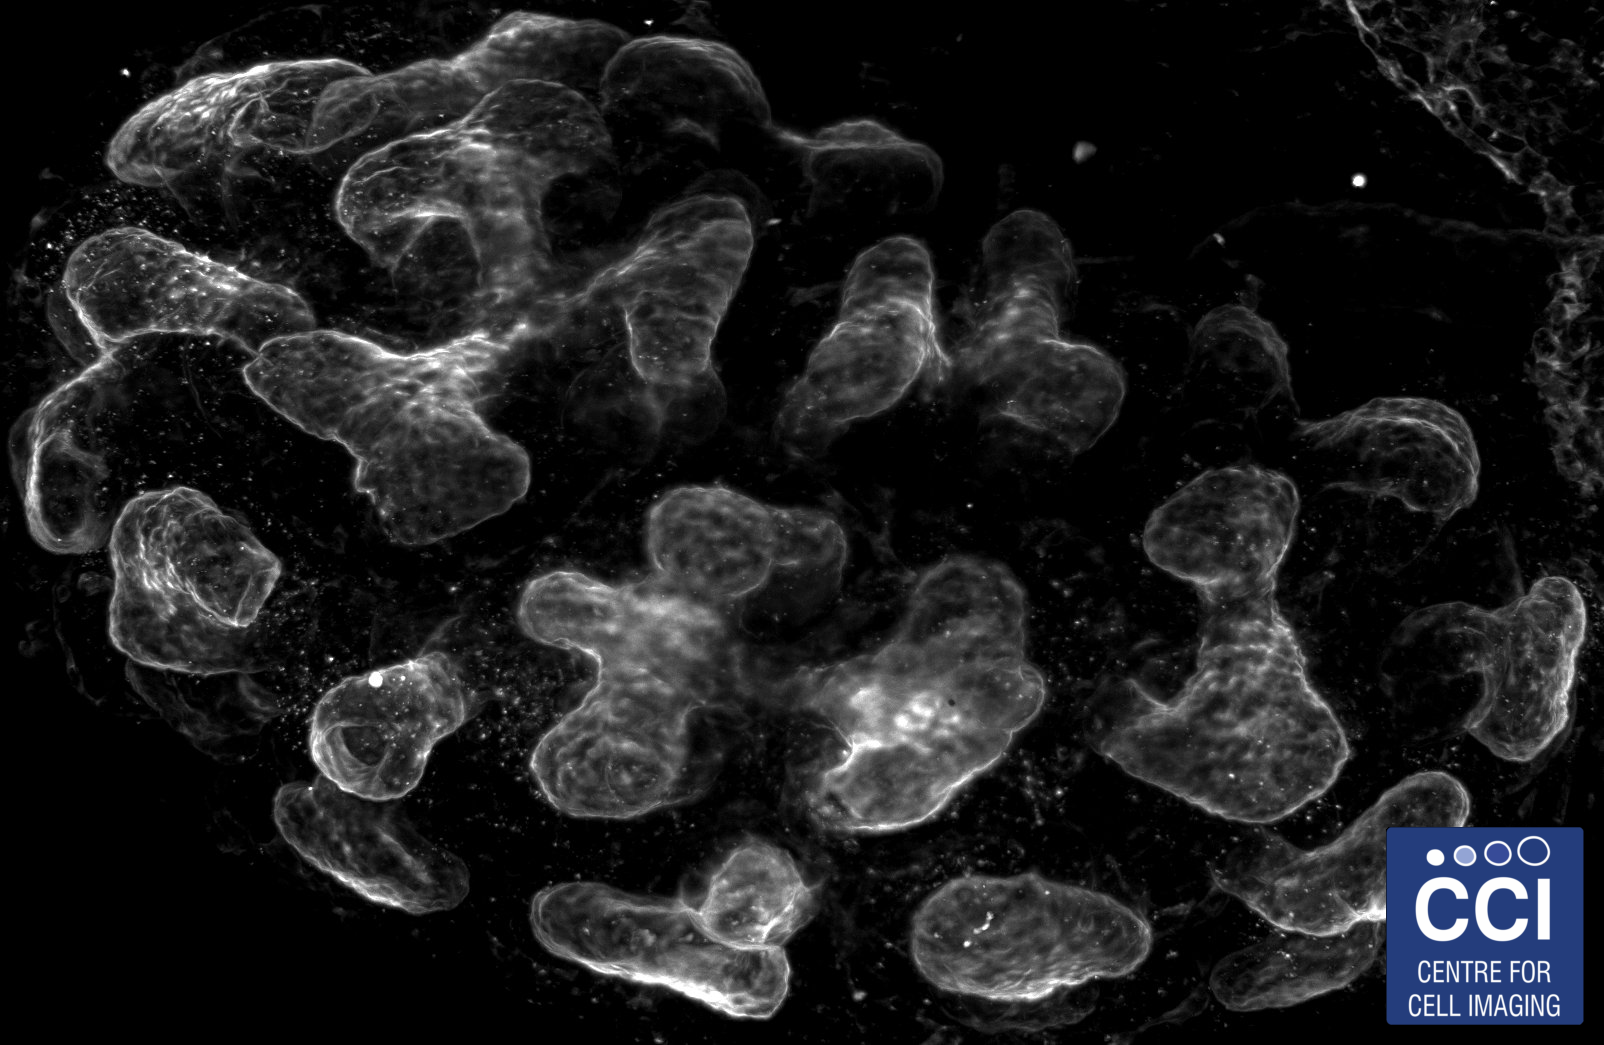
Ureteric tree of a mouse embryonic kidney
A developing kidney from an embryonic mouse can be dissociated into its constituent cells, then re-formed in the presence of other cells to study their incorporation and effect on development of the kidney.
Images acquired on the Lightsheet. Experiment, acquisition and post-processing by Marie Held (Lévy Lab).
Gold (2017 Image Competition)
A Rainbow of Cells
This multichannel image shows HeLa cells expressing a green fluorescent version of the Deleted in Liver Cancer 1 (DLC1) gene. The same protein is labelled in red with antibodies. DNA is shown in blue.
Images acquired on the 880 BioAFM by Rebecca Kelly Sée Lab.
Bronze (2017 Image Competition)
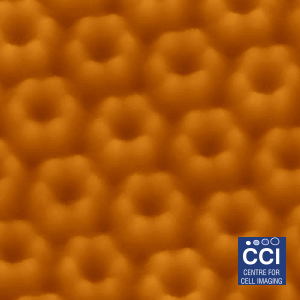
Atomic Force Microscopy (AFM) of bacterial proteins
Using high-resolution AFM, the group of Luning Liu have studied, for the first time, the protein organisation, orientation and self-assembly dynamics of bacterial microcompartment shell facets.
Images taken on the 880 BioAFM. Read more here.
Daphnia development
This time-lapse video shows the embryonic development of Daphnia pulex. Creating time-lapse videos enables us to study the phenotypic changes that occur during Daphnia development.
Live assays allow us to gain an understanding of how development links to life history and how different developmental conditions can influence the variation we see in later life.
Images taken on the Epifluorescent microscope by Megan Hasoon (Plaistow Lab).
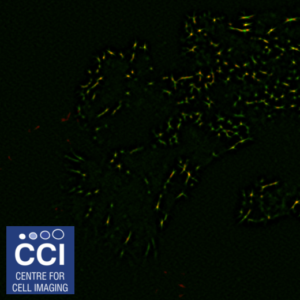
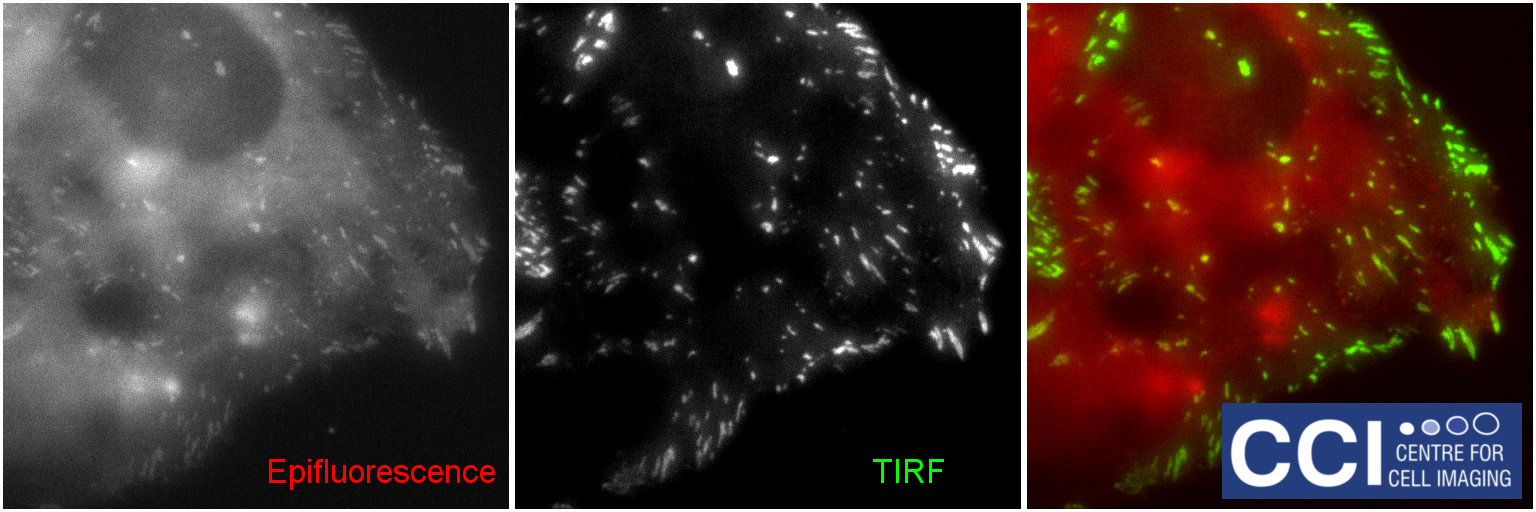
Total Internal Reflection Fluorescence (TIRF)
TIRF microscopy only illuminates fluorophores within ˜100nm of the coverslip. The background from the cell body is removed, therefore excellent signal to noise is achieved. Here, DLC1-GFP is imaged in TIRF (green) and epifluorescence (red) mode and the channels merged. These images were captured using our BioAFM microscope by Jennifer Francis (Sée and Lévy Lab).
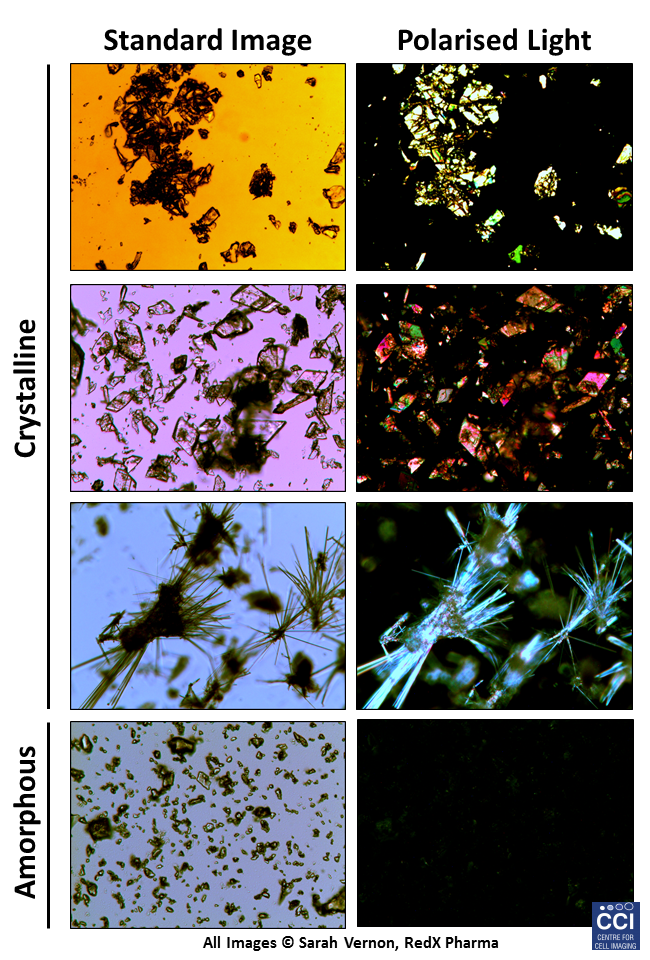
Polarised Light Microscopy
Polarised light microscopy is here used as a screening tool to characterise the solid form of pharmaceutical materials. Crystalline material is birefringent, which when viewed between crossed polarisers displays bright interference colours. Amorphous material is non-birefringent and appears dark against the background.
Images taken on the Epifluorescent microscope courtesy of Sarah Vernon (RedX Pharma).
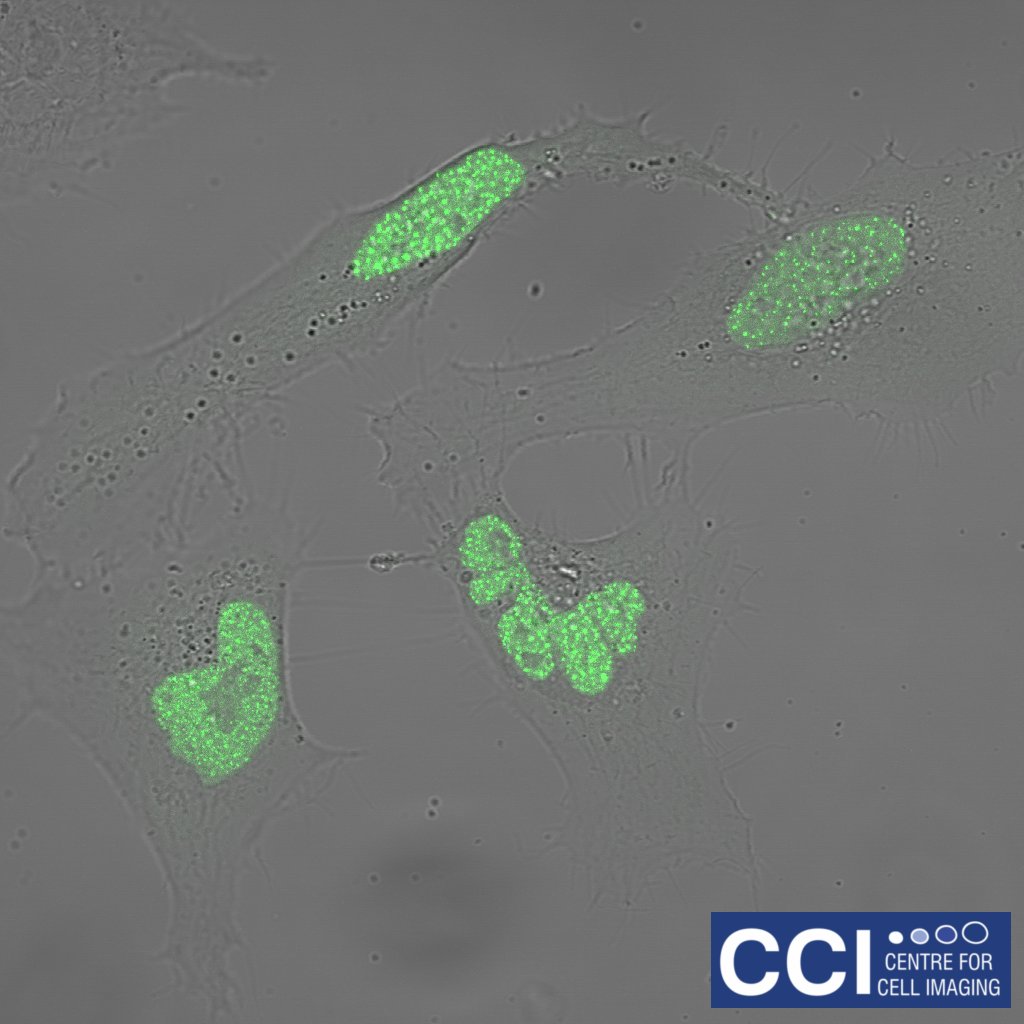
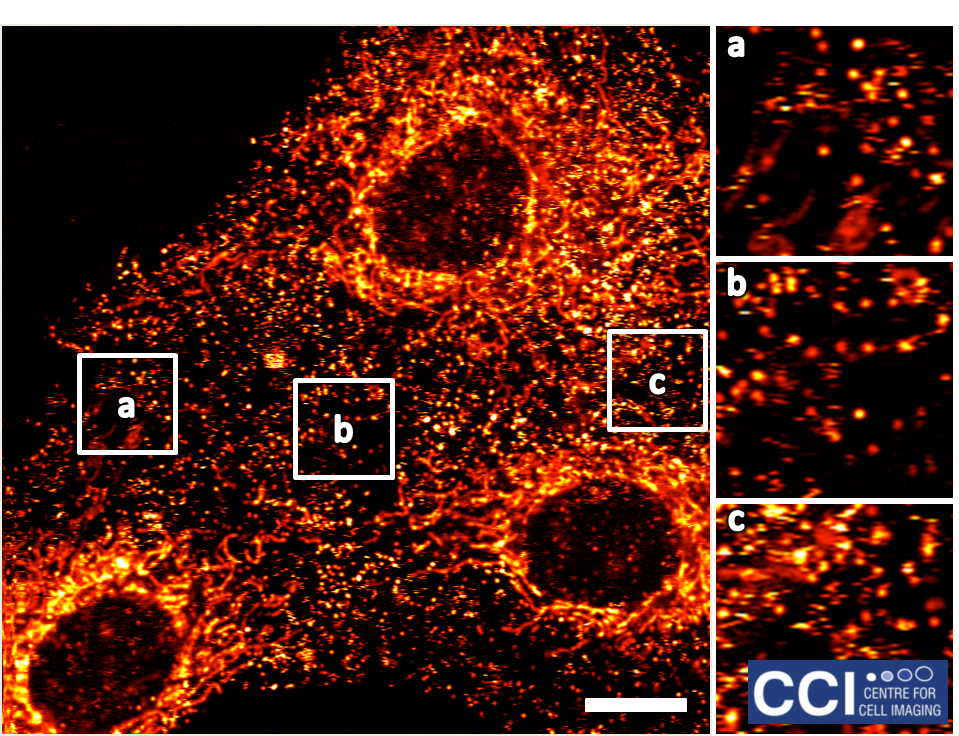
Hypoxia Inducible Factors
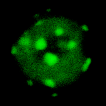
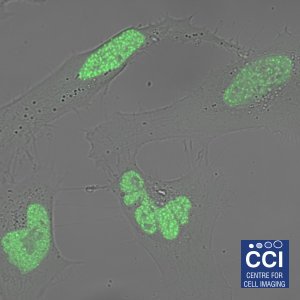
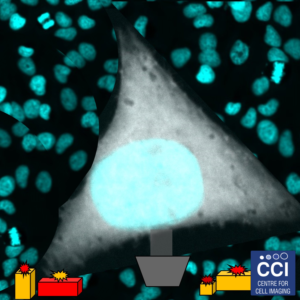
Cells respond to low oxygen levels through the action of Hypoxia Inducible Factors (HIFs). Here HIF-2α is shown to localise in nuclear 'speckles'.
Image courtesy of Sarah Taylor (Sée Lab).
Cells respond to low oxygen levels through the action of Hypoxia Inducible Factors (HIFs). Here HIF-2α is shown to localise in nuclear 'speckles'.
Image courtesy of Sarah Taylor (Sée Lab).
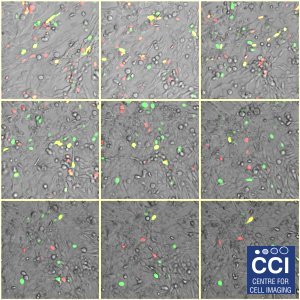
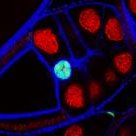
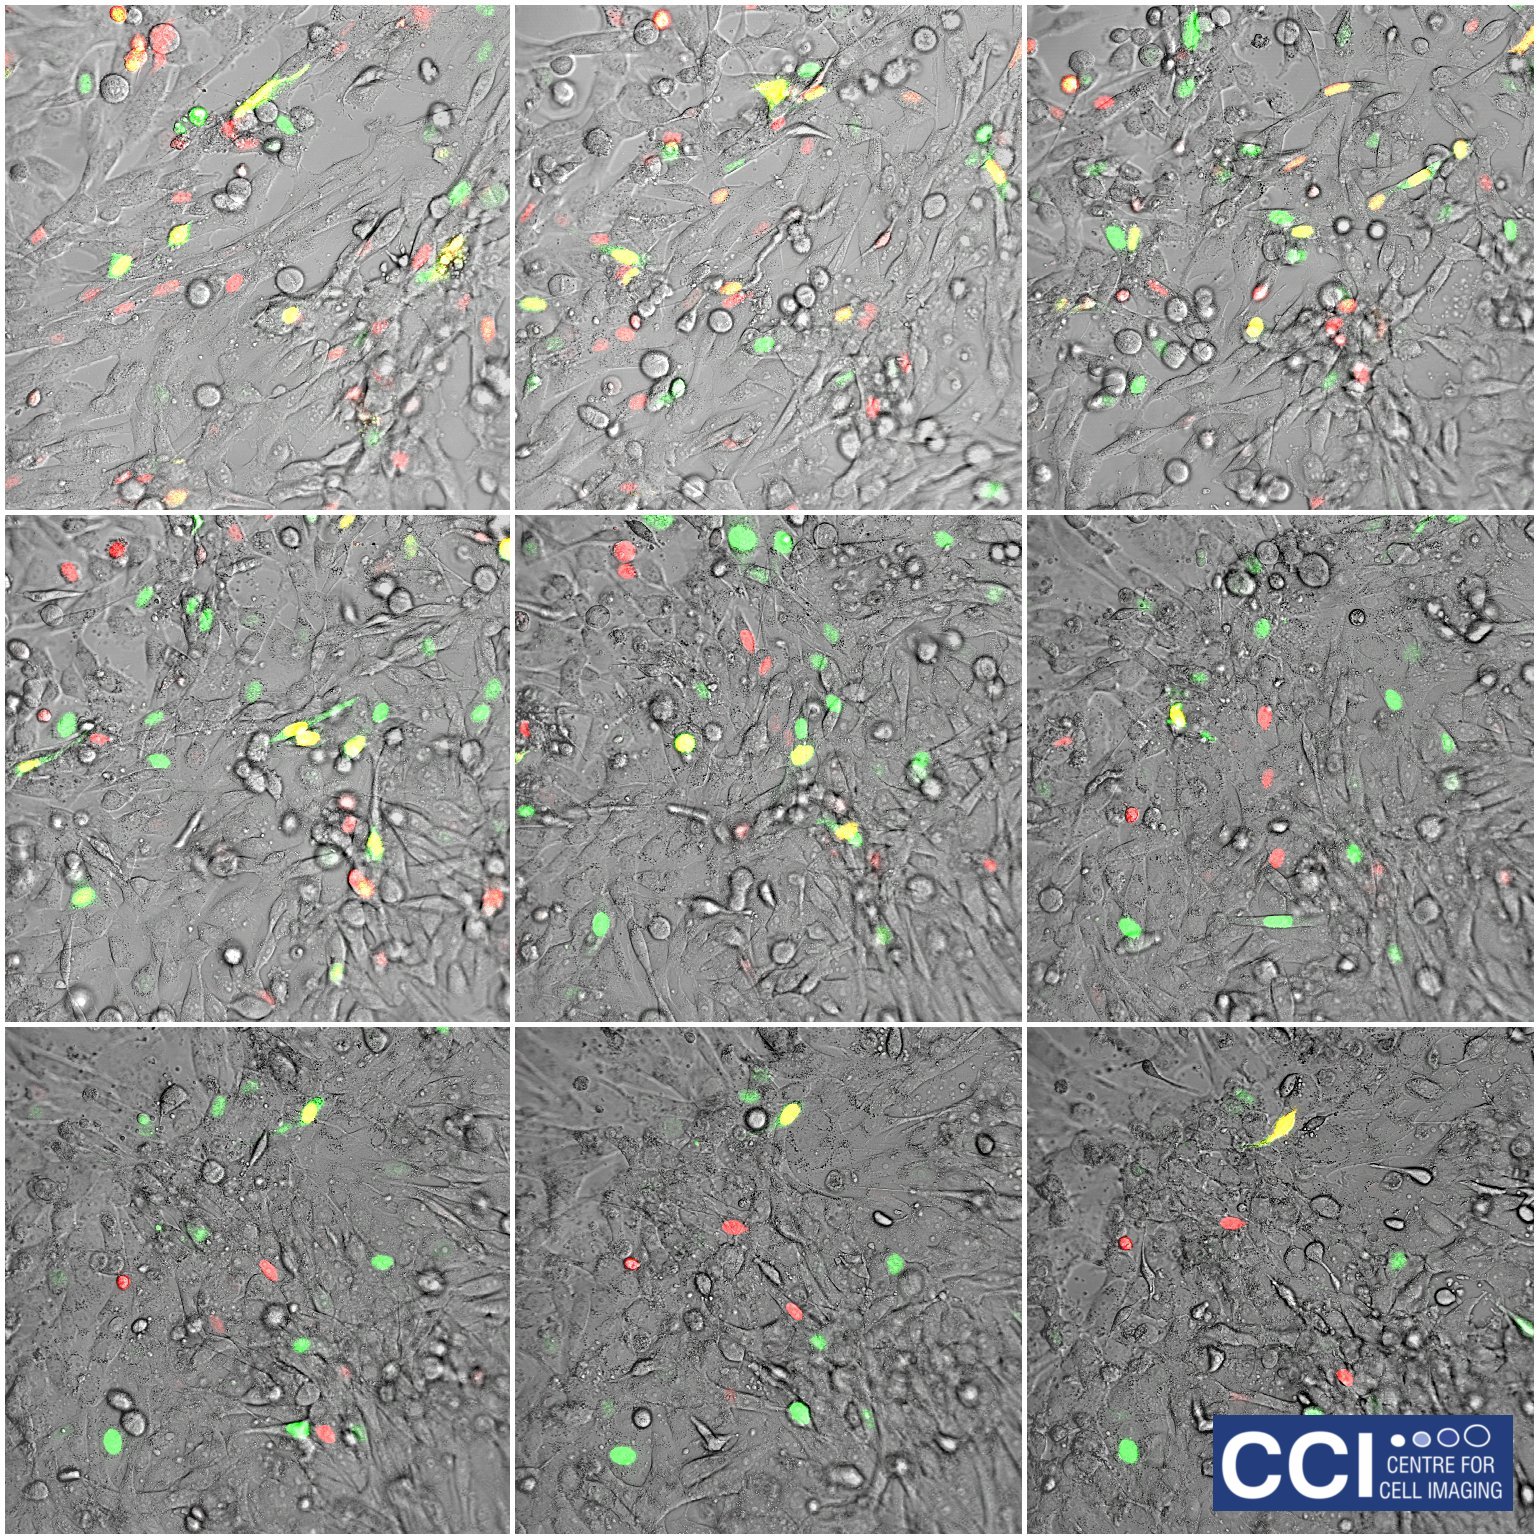
HeLa cells expressing FUCCI probes
A montaged timecourse of a fibroblast cell line (HeLa cells) expressing the FUCCI probe. FUCCI cells changes colour based upon the cell cycle stage. These images were captured under hypoxia on our 710 Microscope.
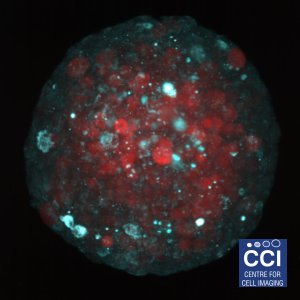
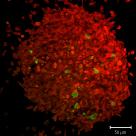
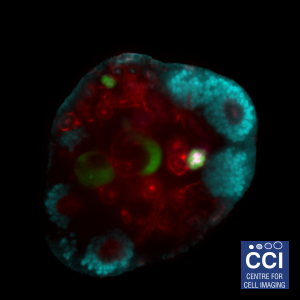
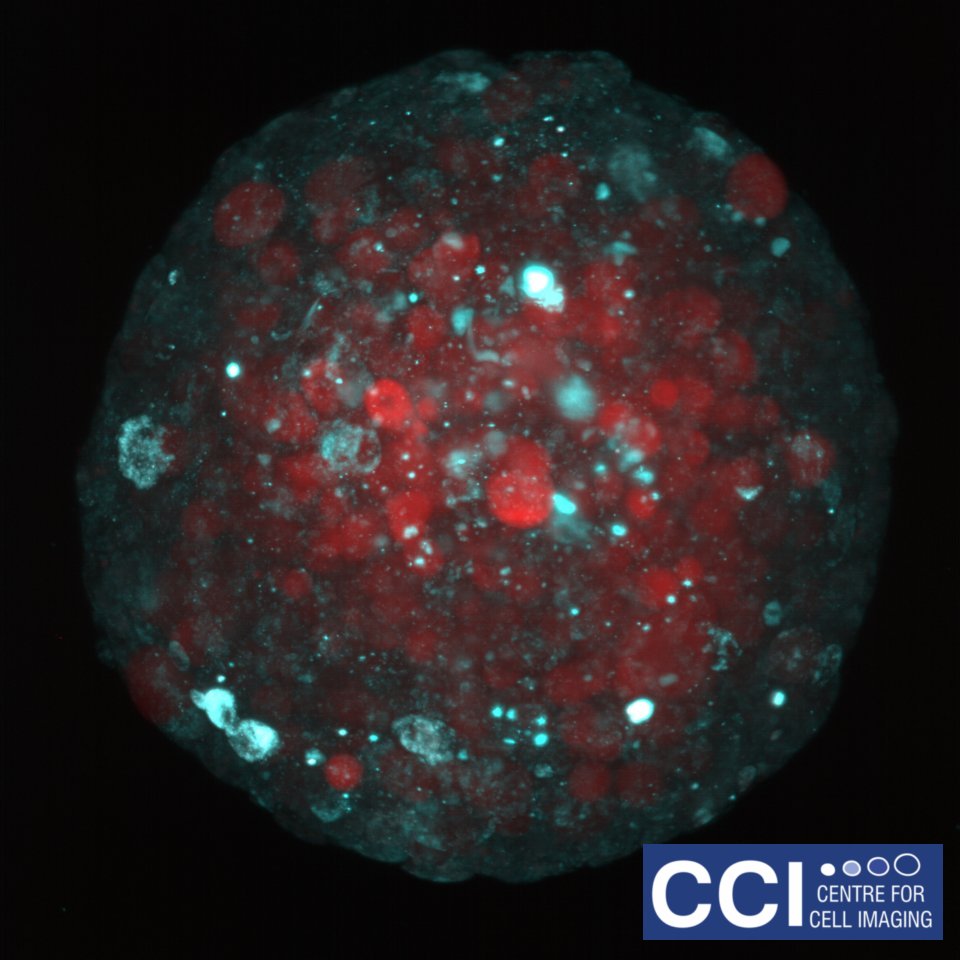
Metabolic Markers in Spheroids
Spheroids are an excellent model system for studying the biology of tumours. Here cancer cells are labelled to study how glucose metabolism alters throughout the sphere.
Large spheroids like this and even small organisms can be imaged on our Lightsheet Microscope.
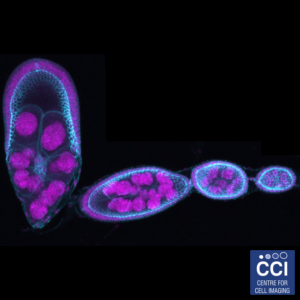
Drosophila egg development
Drosophila are a useful model organism to study the effects of gene knockout or knockdown. Here, stages of Drosophila egg development are shown depicting cell nuclei (magenta) and cell-cell junction (Cyan).
Imaged on the LSM 710 microscope by Hammed Badmos (Bennett Group).
Gold (2018 Image Competition)
Transmitted light Imaging
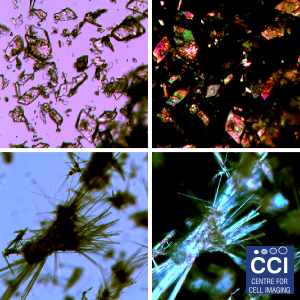
Brightfield imaging relies on the scattering of light passing through the sample to identify areas of contrast. Several variants of this technique exist to enhance the contrast through interference (DIC:above) and modulation of light polarisation.
This sample is a section from a potato (Solanum tuberosum) imaged on the Epifluorescent microscope by Dave Mason (CCI). The starch granules are highly birefringent and so make an excellent standard for polarised light microscopy.
Compartmentalisation and location of bacterial carbon-fixation organelles
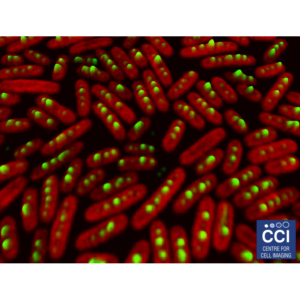
The carboxysomes (here labelled green) in cyanobacteria are responsible for concentrating CO2 to allow efficient photosynthesis. The autofluorescence of the chlorophyll is shown in red.
Images acquired on the LSM 780 by Luning Liu.
Neural development in Drosophila
Drosophila are regularly used in research to study the effect of genes on development. This dataset shows the effect of oncogenic cooperation between Ras and pico co-overexpression. Tumour cells are in green, activated JNK in red and glia in blue.
This z-stack was taken on the 710 Microscope by members of the Bennett Lab and post-processed by Dave Mason.
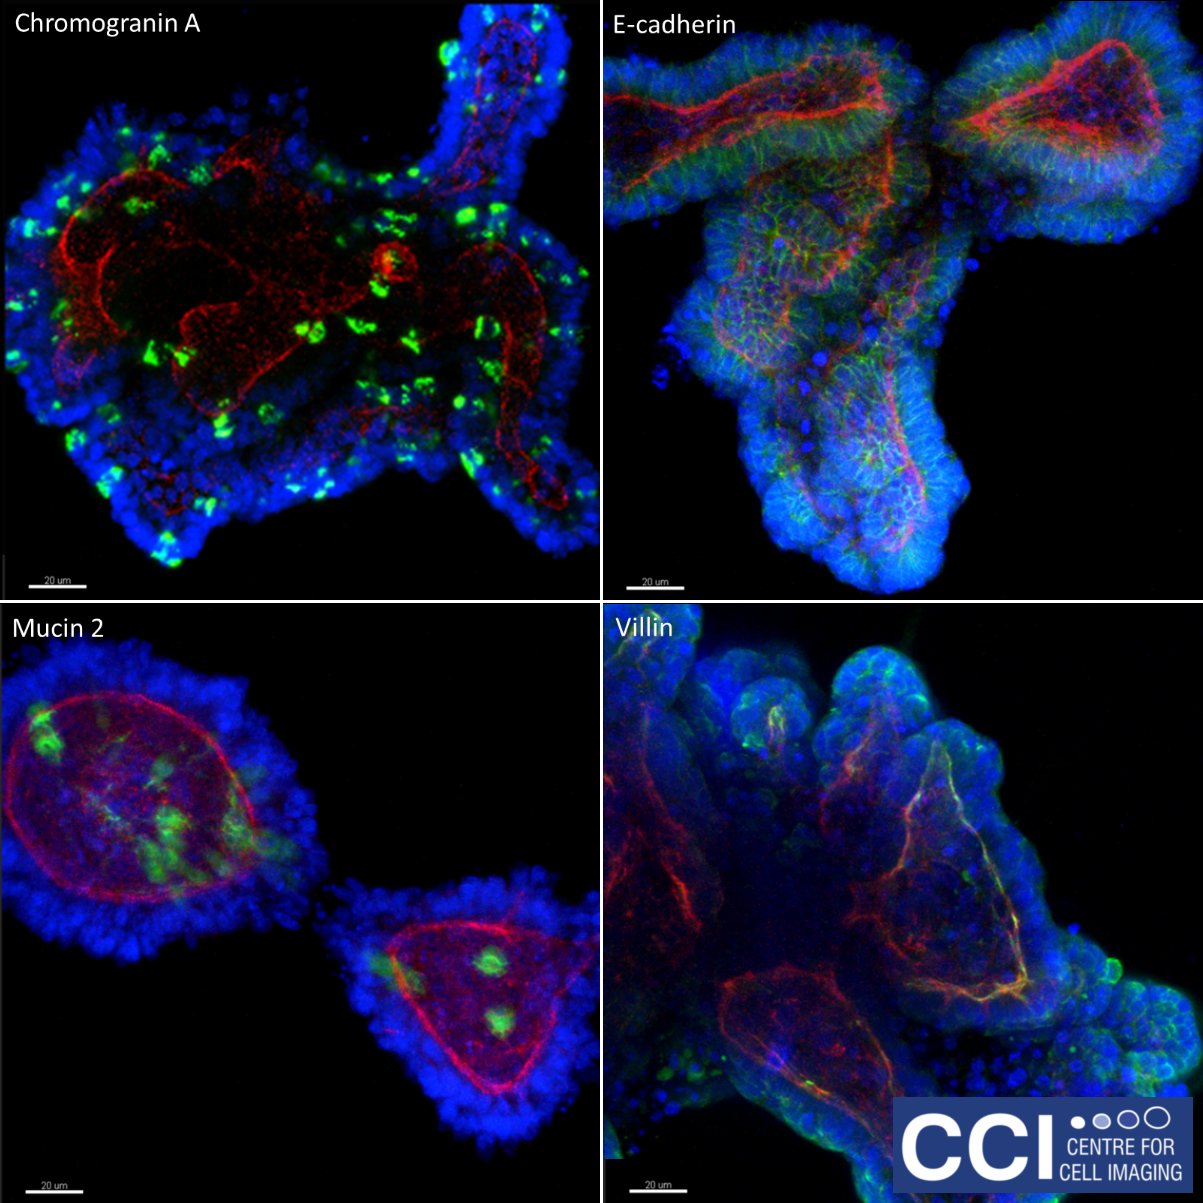
3D organoid cultures
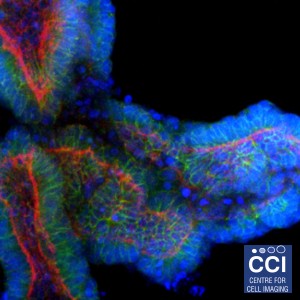
These organoids are made of porcine intestinal epithelium, grown in 3D cultures. Differentiated epithelial cell types are demonstrated by staining for tight junctions (e-cadherin), goblet cells (mucin 2), enteroendocrine cells (chromogranin A) and epithelial polarisation (villin). The green colour shows the labelled marker, f-actin is labelled red and DNA is labelled in blue.
Imaged on the 880 Multiphoton microscope by Hayley Derricott (Coombes Lab).
Quantitation of Wound Healing
The idea behind a wound healing assay is simple: grow cells to cover a surface, scratch a 'wound' into the cells then watch the wound 'heal' (either by cell replication, migration or a combination of both).
The rate of wound healing can be quantified post-acquisition, furthermore the wound area (green) and wound edges (red) can be visualised.
Experimental data courtesy of Daimark Bennett. Analysis and visualisation by Dave Mason.
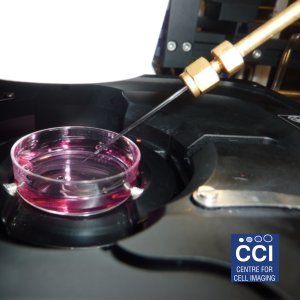
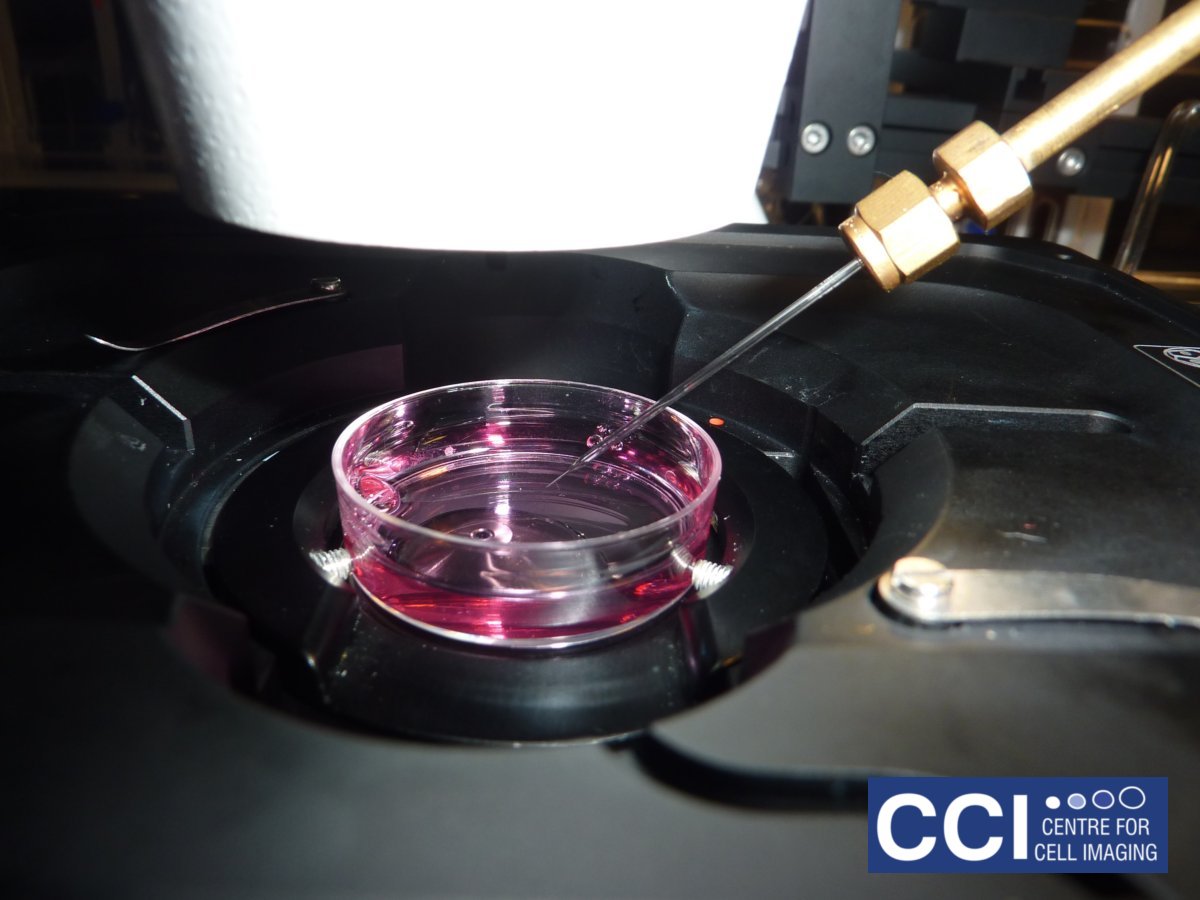
Microinjection
There are many ways to introduce proteins, DNA or drugs into cells, few are as versatile as microinjection. At the CCI, you can microinject on the Epifluorescent Microscope.
Self-assembled mouse embryonic renal tissue
A developing kidney from an embryonic mouse can be dissociated into its constituent cells, then re-formed in the presence of other cells to study their incorporation and effect on development of the kidney. This single slice shows Six2 (cyan), Wt1-GFP (green), tubular structures (red) and podocytes in the glomeruli (magenta).
Images acquired on the Lightsheet. Experiment, acquisition and post-processing by Marie Held (Lévy Lab).
Imaging live brain activity in Zebrafish
Day 1 casper zebrafish were imaged with our Light Sheet Microscope. The aim is to measure the activity in the brain during stimulation to understand what areas and even which neurons are involved in processing information.
Sample courtesy of Lynne Sneddon and Kieran Pounder. Image acquisition and movie courtesy of Marco Marcello.
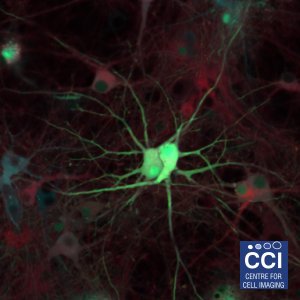
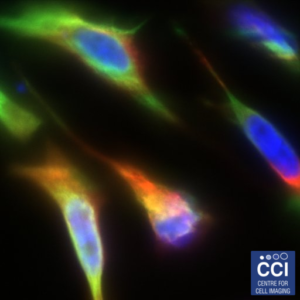
Neuronal Co-Culture
This image shows living primary hippocampal neurons and astrocytes infected with lentiviruses expressing three different proteins tagged with Venus, Cyan, and Red Fluorescent Proteins.
Image taken on the 780 microscope, courtesy of Joanna Wardyn (Sanderson Lab).
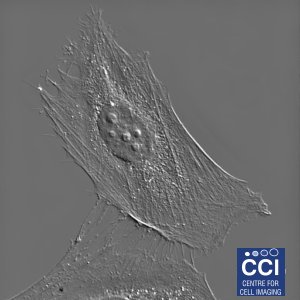
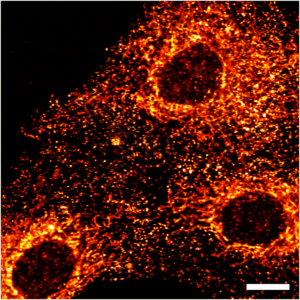
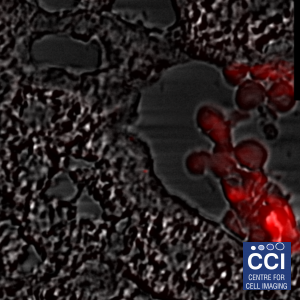
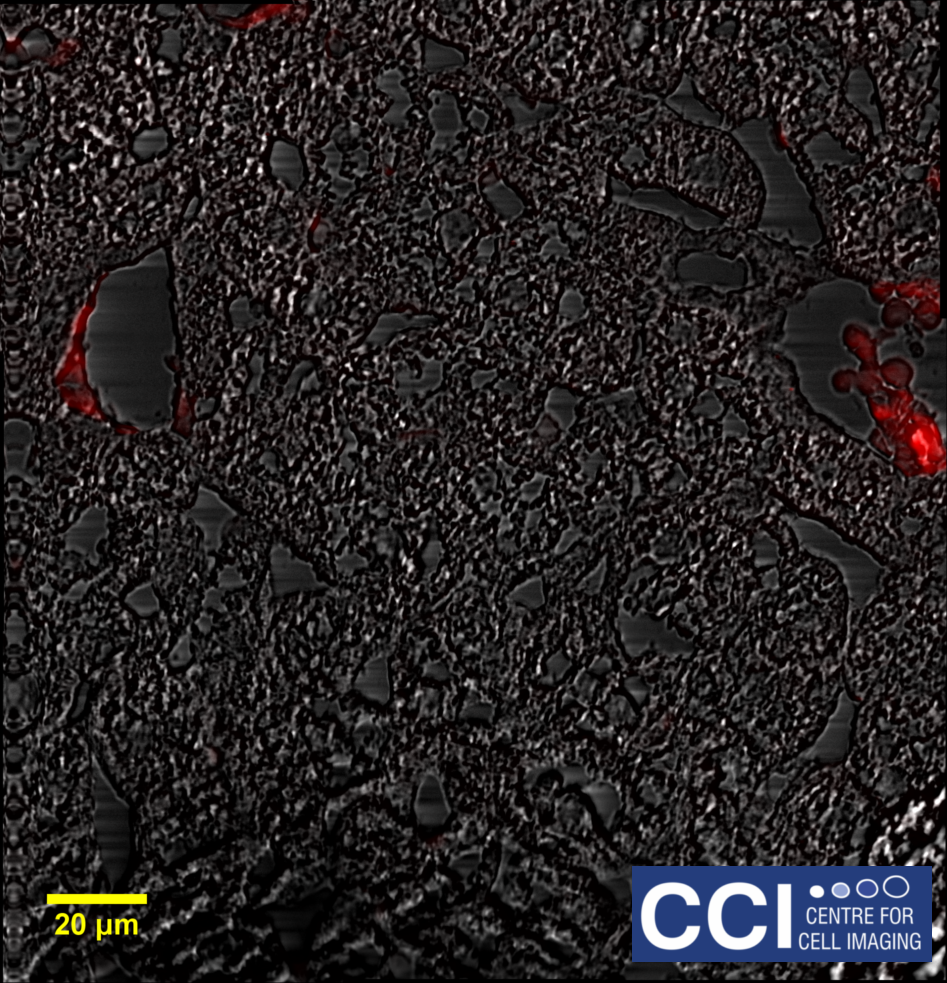
Differential Interference Contrast Imaging
DIC imaging is a type of optical interferometry used to visualise differences in the optical path length. Using this technique, very finely detailed structures can be seen without the need for complicated sample preparation. In this DIC image of a HeLa cell, many structures are visible including filopodia, nucleoli, vesicles and cytoskeletal networks.
Image courtesy of Dave Mason.
Competition Entries
Below are some images submitted for the facility Festive Imaging Competition. The winners were selected by anonymous public vote.
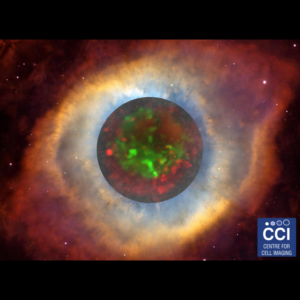
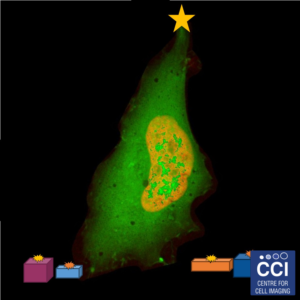
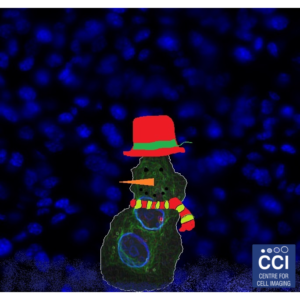
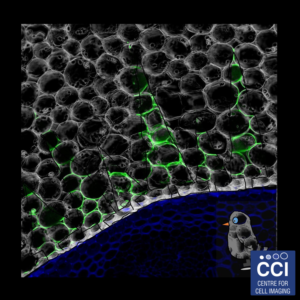

Rudolph with a carboxysome nose and some carboxysome shell protein snowflakes
Submitted by Matt Faulkner (Liu Group) for the 2017 competition.
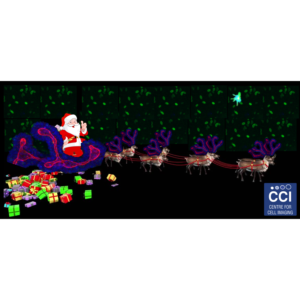
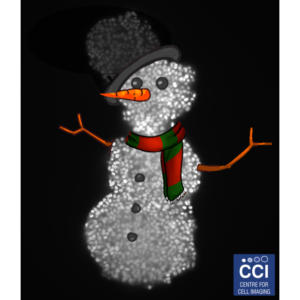
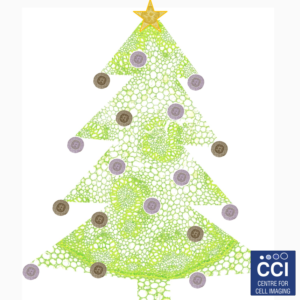
Dashing through the snow, on an organoidy sleigh
Submitted by Hayley Derricott (Coombes Group) for the 2017 competition. Won 3rd place.
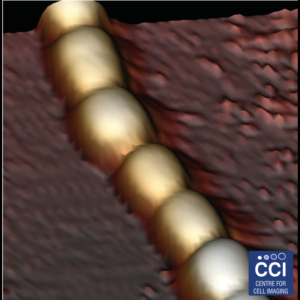
Bronze (2017)
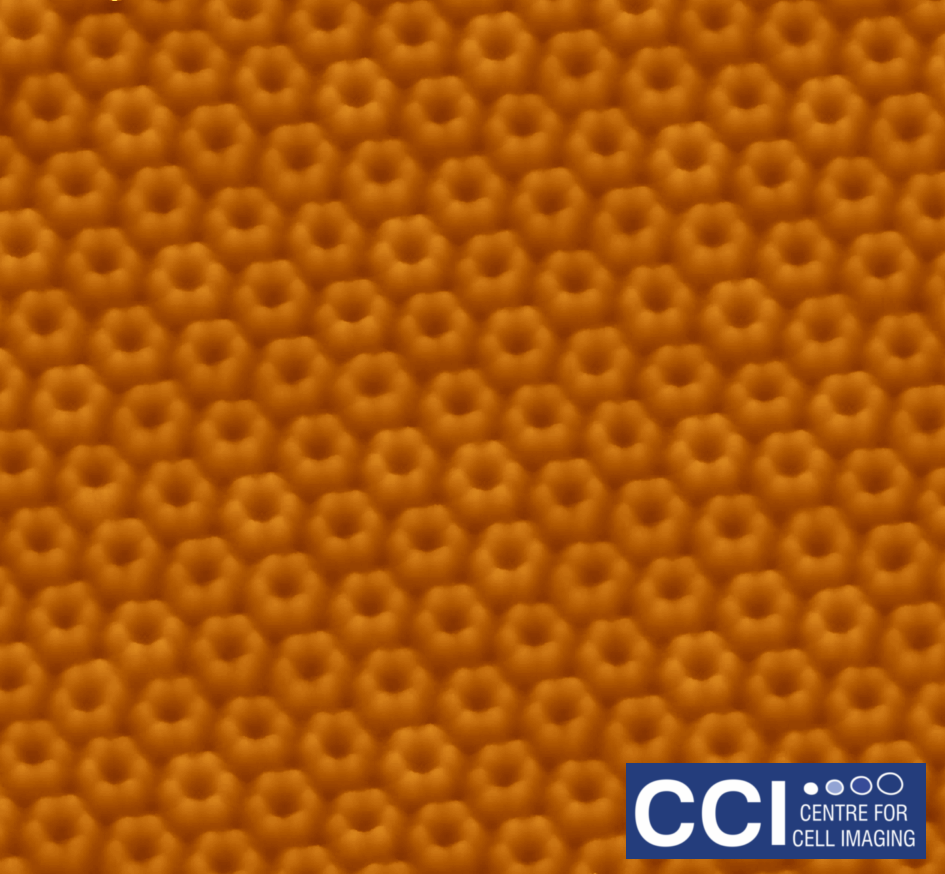
Using high-resolution AFM, the group of Luning Liu have studied, for the first time, the protein organisation, orientation and self-assembly dynamics of bacterial microcompartment shell facets.
Images taken on the 880 BioAFM. Read more here.
TIRF microscopy only illuminates fluorophores within ˜100nm of the coverslip. The background from the cell body is removed, therefore excellent signal to noise is achieved. Here, DLC1-GFP is imaged in TIRF (green) and epifluorescence (red) mode and the channels merged. These images were captured using our BioAFM microscope by Jennifer Francis (Sée and Lévy Lab).
Polarised light microscopy is here used as a screening tool to characterise the solid form of pharmaceutical materials. Crystalline material is birefringent, which when viewed between crossed polarisers displays bright interference colours. Amorphous material is non-birefringent and appears dark against the background.
Images taken on the Epifluorescent microscope courtesy of Sarah Vernon (RedX Pharma).
A montaged timecourse of a fibroblast cell line (HeLa cells) expressing the FUCCI probe. FUCCI cells changes colour based upon the cell cycle stage. These images were captured under hypoxia on our 710 Microscope.
Spheroids are an excellent model system for studying the biology of tumours. Here cancer cells are labelled to study how glucose metabolism alters throughout the sphere.
Large spheroids like this and even small organisms can be imaged on our Lightsheet Microscope.
These organoids are made of porcine intestinal epithelium, grown in 3D cultures. Differentiated epithelial cell types are demonstrated by staining for tight junctions (e-cadherin), goblet cells (mucin 2), enteroendocrine cells (chromogranin A) and epithelial polarisation (villin). The green colour shows the labelled marker, f-actin is labelled red and DNA is labelled in blue.
Imaged on the 880 Multiphoton microscope by Hayley Derricott Coombes Lab).
There are many ways to introduce proteins, DNA or drugs into cells, few are as versatile as microinjection. At the CCI, you can microinject on the Epifluorescent Microscope.
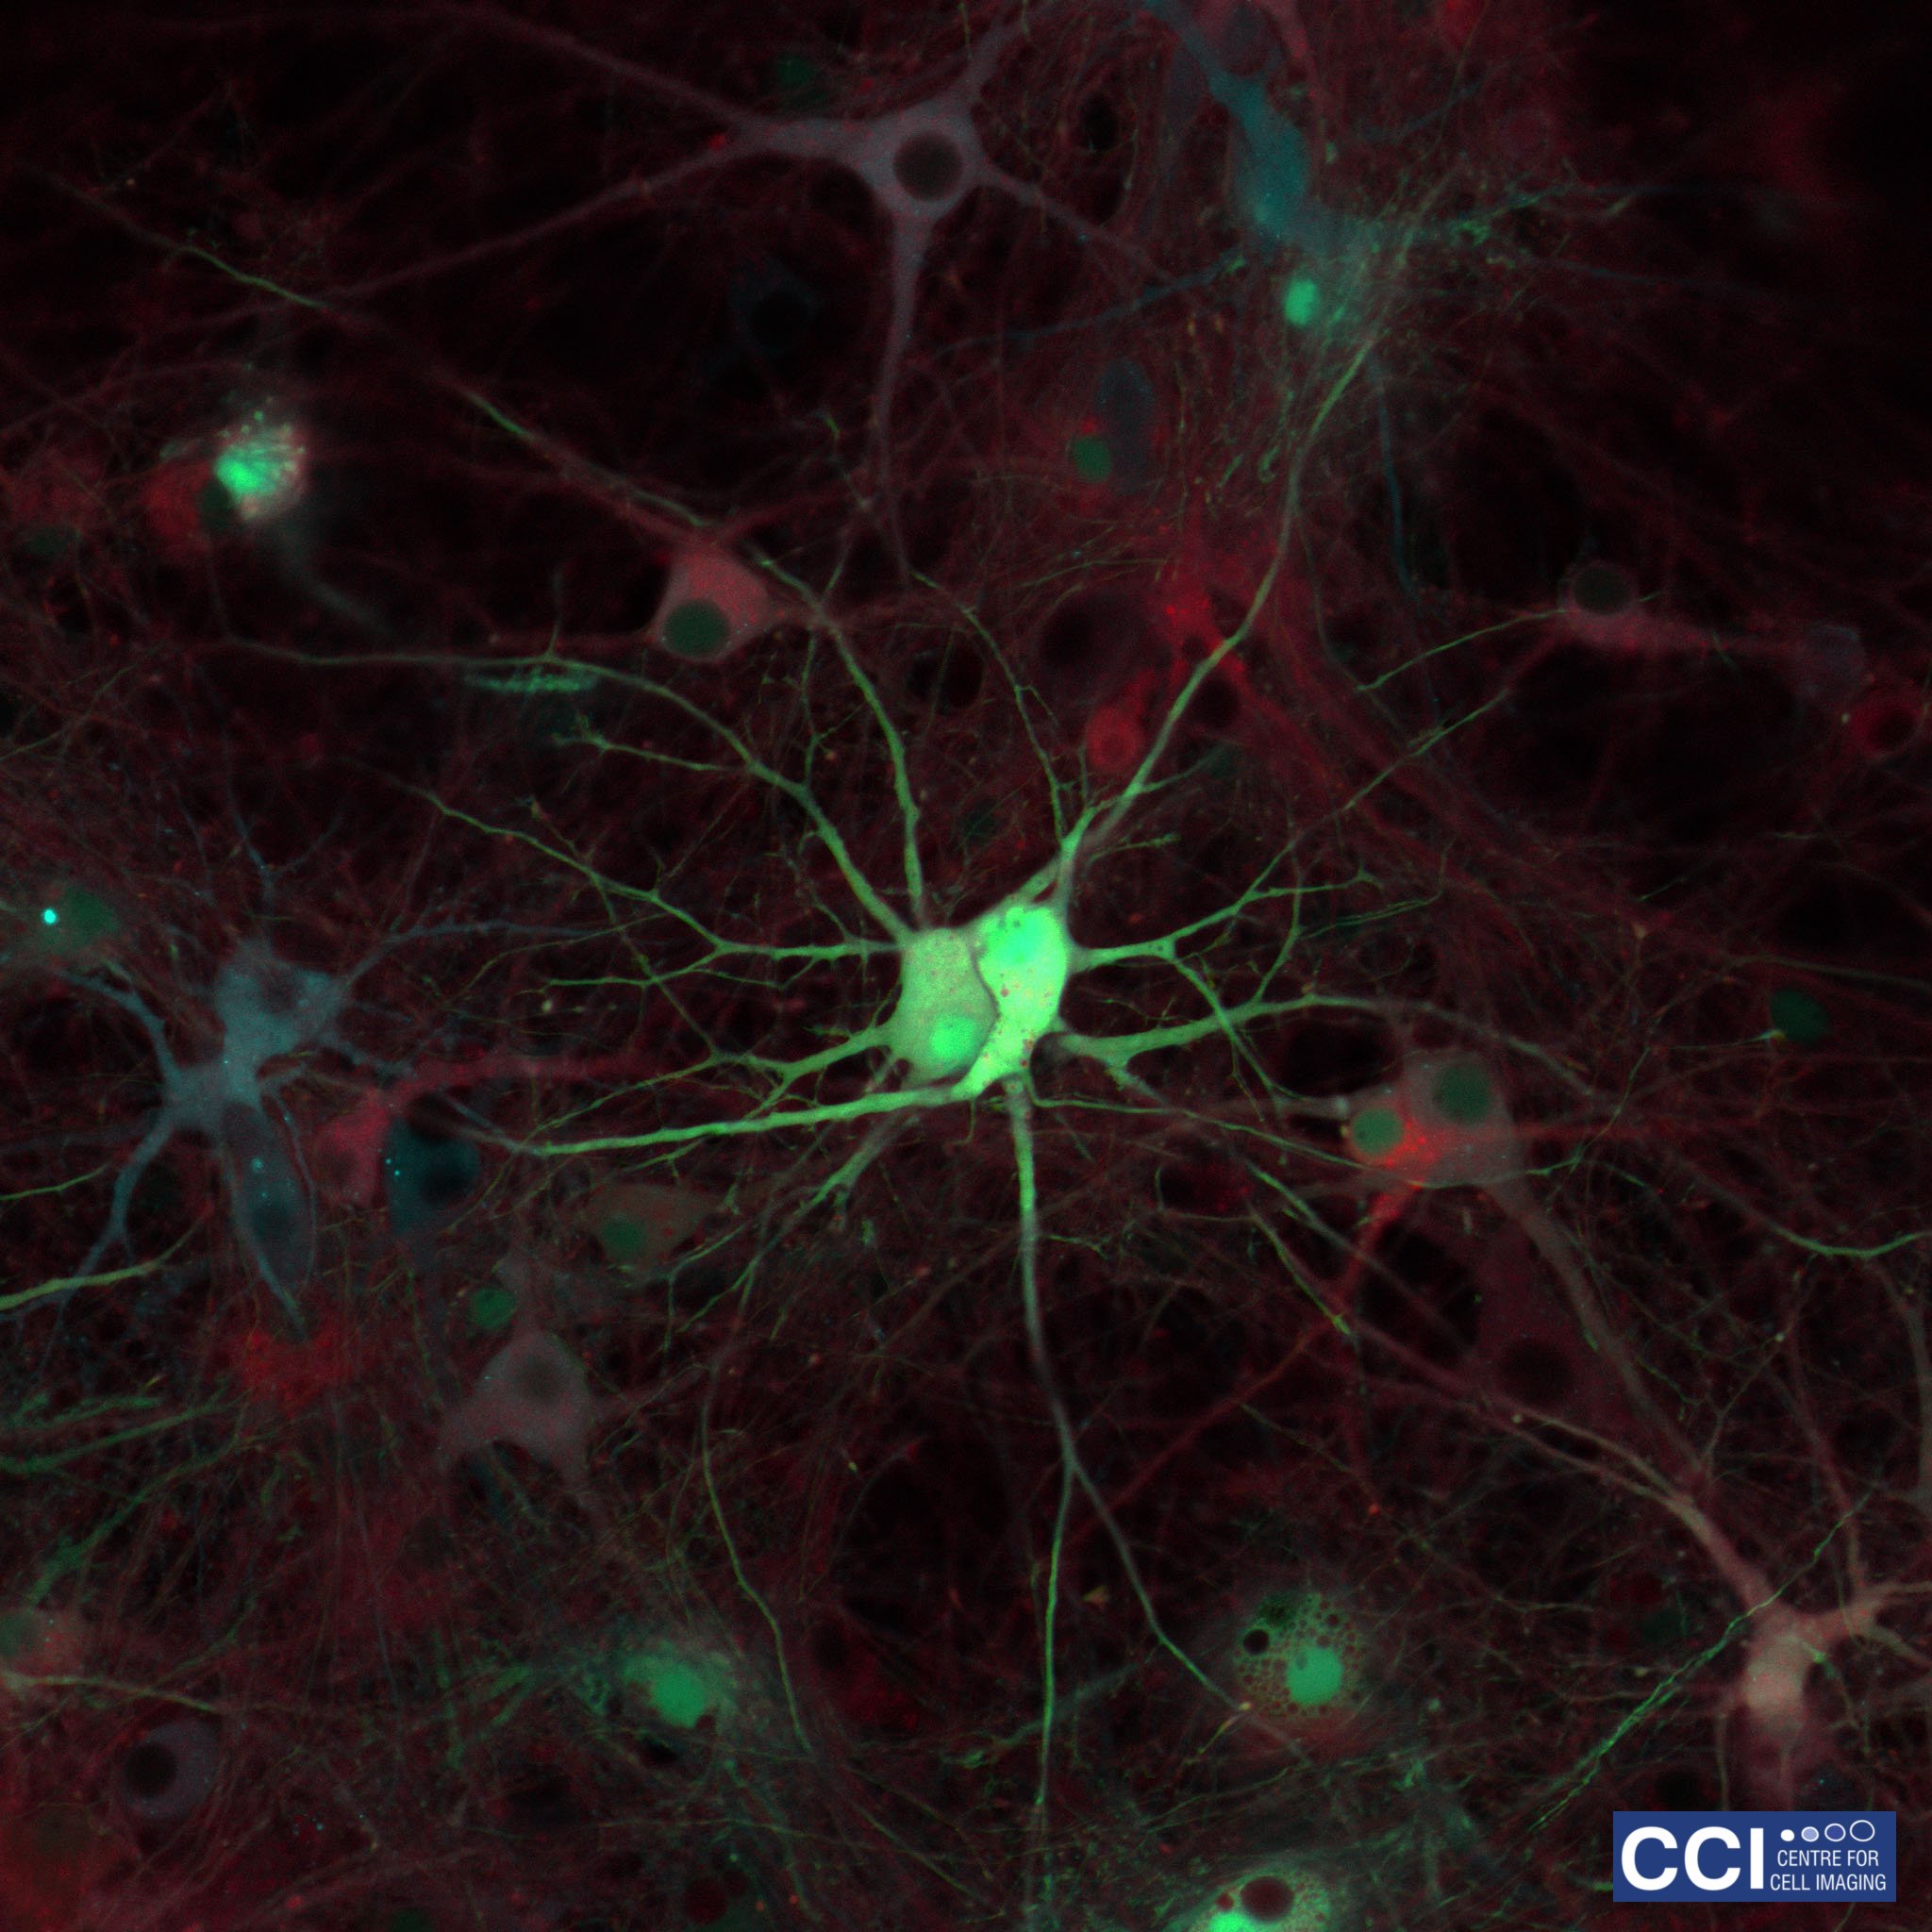
This image shows living primary hippocampal neurons and astrocytes infected with lentiviruses expressing three different proteins tagged with Venus, Cyan, and Red Fluorescent Proteins.
Image taken on the 780 microscope, courtesy of Joanna Wardyn (Sanderson Lab).
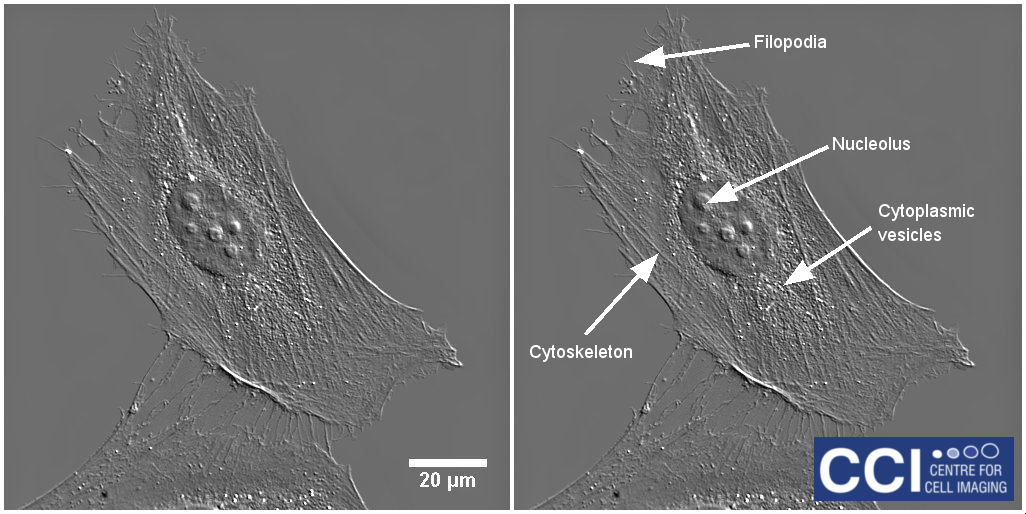
DIC imaging is a type of optical interferometry used to visualise differences in the optical path length. Using this technique, very finely detailed structures can be seen without the need for complicated sample preparation. In this DIC image of a HeLa cell, many structures are visible including filopodia, nucleoli, vesicles and cytoskeletal networks.
Image courtesy of Dave Mason.
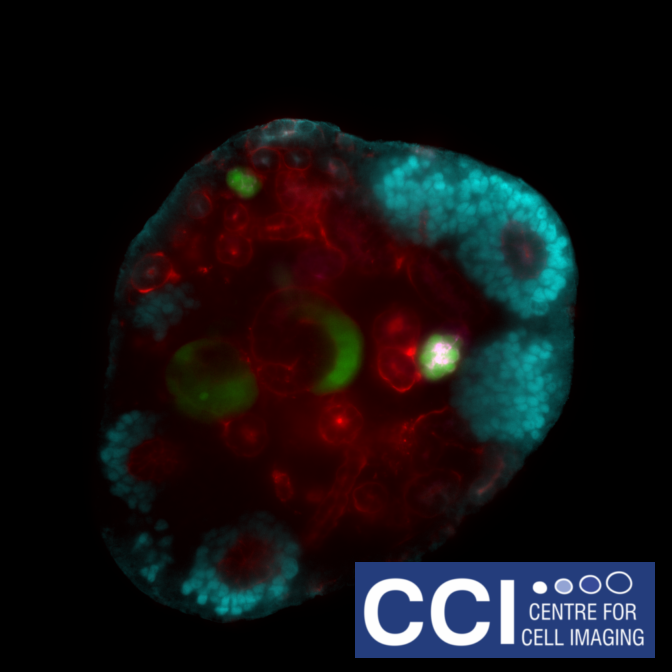
A developing kidney from an embryonic mouse can be dissociated into its constituent cells, then re-formed after inclusion of other cells to study their incorporation and affect on devlopment of the kidney. This single slice shows Six2 (cyan), Wt1-GFP (green), tubular structures (red) and podocytes in the glomeruli (magenta).
Images acquired on the Lightsheet. Experiment, acquisition and post-processing by Marie Held (Lévy Lab).
Brightfield imaging (top left) relies on the scattering of light passing through the sample to identify areas of contrast. Several variants of this technique exist to enhance the contrast through interference (DIC:top right) and modulation of light polarisation (bottom left).
This sample is a section from a potato (Solanum tuberosum) imaged on the Epifluorescent microscope by Dave Mason (CCI). The starch granules are an excellent standard for polarised light microscopy.
A developing kidney from an embryonic mouse can be dissociated into its constituent cells, then re-formed after inclusion of other cells to study their incorporation and affect on devlopment of the kidney.
Images acquired on the Lightsheet. Experiment, acquisition and post-processing by Marie Held (Lévy Lab).
Gold (2017 Image Competition)

This multichannel image shows HeLa cells expressing a green fluorescent version of the Deleted in Liver Cancer 1 (DLC1) gene. The same protein is labelled in red with antibodies. DNA is shown in blue.
Images acquired on the 880 BioAFM by Rebecca Kelly Sée Lab.
Bronze (2017 Image Competition)
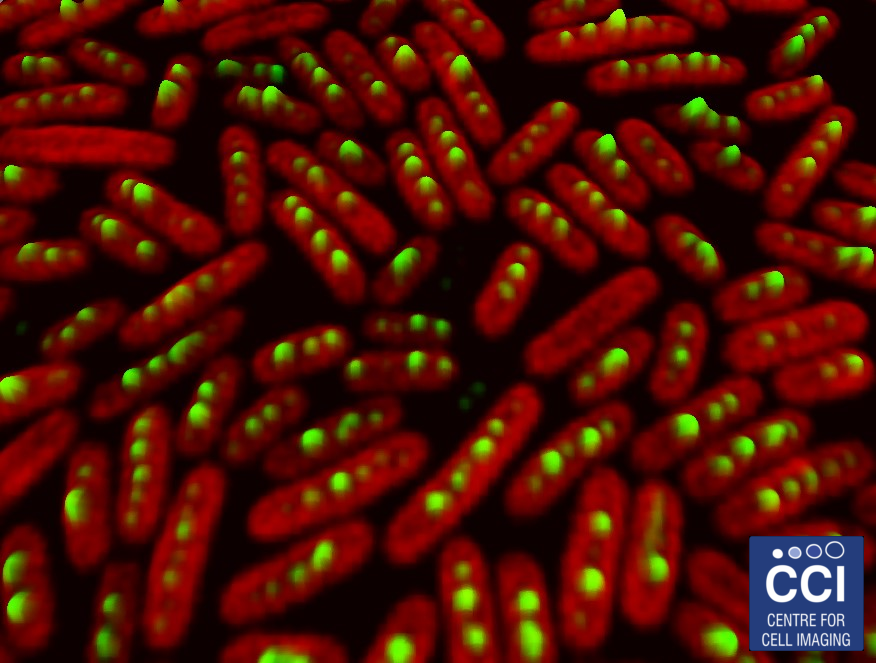
The carboxysomes (here labelled green) in cyanobacteria are responsible for concentrating CO2 to allow efficient photosynthesis. The autofluorescence of the chlorophyll is shown in red.
Images acquired on the LSM 780 by Luning Liu.
Bronze (2017 Image Competition)

Tumours developed in a chick embryo model can be imaged at high resolution over a large area by tilescanning. In this case, 9 fields were imaged then stitched together to form a single field of view ~640μm squared. Implanted cells are shown in green, nuclei in blue and a protein of interest is shown in red.
Images acquired on the LSM 710 by Elysia Lindley and Anne Herrmann (Sée Lab).
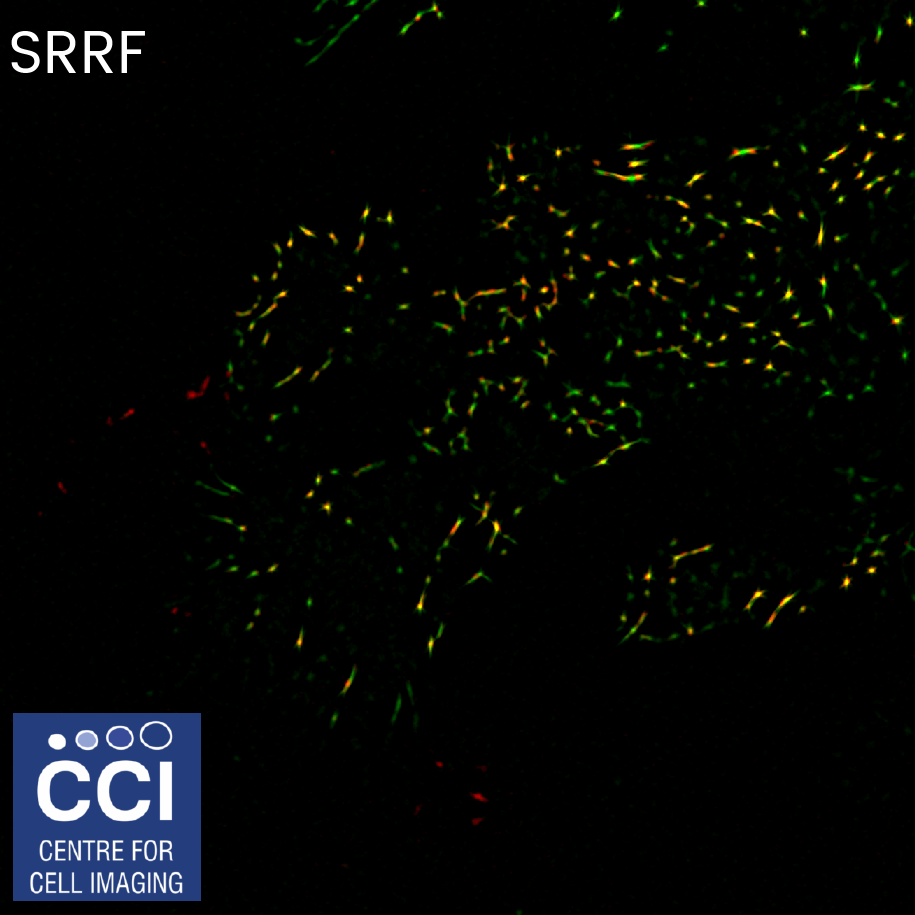
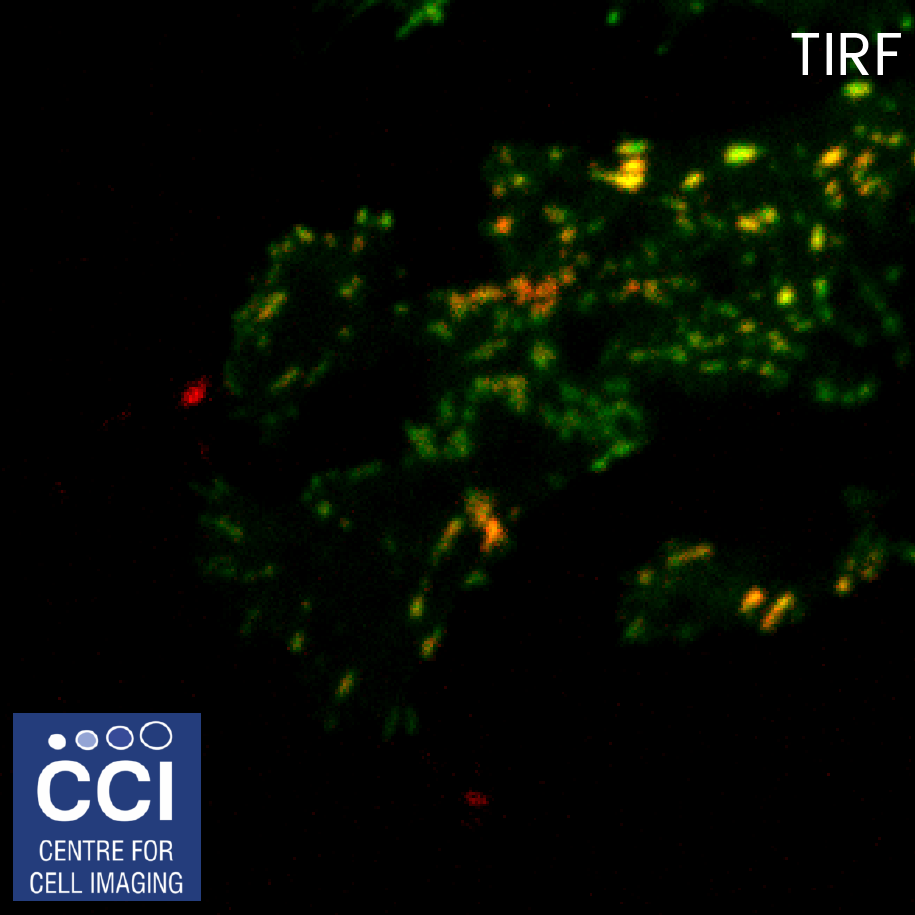
Focal adhesions are highly complex clusters of proteins and signalling molecules. Total Internal Refelction Fluorescence (TIRF) Microscopy drastically improves the image contrast as well as providing super resolution in the Z-plane. Here, TIRF images of DLC1 (red) and Talin (green) were imaged in TIRF mode using inline SRRF processing. Moving the slider lets you visualise before and after SRRF processing.
Images acquired on the Dragonfly. Sample provided by Rebecca Kelly (Sée Lab).
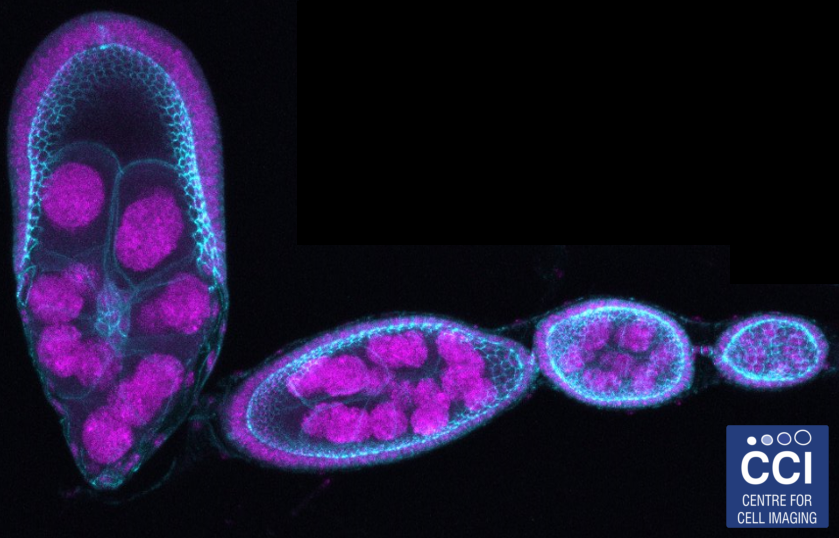
Drosophila egg development
Drosophila are a useful model organism with which to study the effects of gene knockout or knockdown. Here, stages of Drosophila egg development are shown depicting cell nuclei (magenta) and cell-cell junction (Cyan).
Imaged on the LSM 710 microscope by Hammed Badmos (Bennett Group).
Gold (2018 Image Competition)
Presentations & Talks
Dave Mason from the CCI gives an overview of the Fundamentals of Microscopy. The talk covers the basics of transmission and fluorescence microscopy, the lightpath of a widefield microscope and the formation of an image.
This talk was given as part of the 2017 CCI Imaging Workshop held on the 11th September 2017.
Using examples from facility users, Dave Mason presents imaging and microscopy to a visiting school group, on a journey through 5-dimensions
This talk was recorded on the 10th January 2017 when sixth formers from Shrewsbury School visited the Institute of Integrative Biology for the day.
© Liverpool Centre for Cell Imaging