
Image Analysis & Data Management
Modern biological imaging produces vast amounts of data. At the CCI we have the infrastructure and expertise to be able to support users in the storage and analysis across the range of size scales from a few megabytes to terabytes.
We also have a mix of commercial and free/open-source software packages for image analysis installed on several workstations located in the Image Analysis Suite. Our staff include a Technical Specialist in Image Analysis to aid with your experimental design and post-acquisition quantitation. Please get in touch if you have any questions.
Case Studies
Reproducible research requires good quantitation. Users of the CCI have wide and varied projects which often require bespoke analysis solutions. Below are some examples of the type of analysis we do and teach on a regular basis. Please get in touch if you would like more information, or would like to arrange a meeting with our staff Image Analyst.
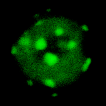
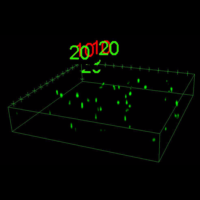
Spot Counting
Whether you're interested in counting colonies on a plate, cells in a dish or zebrafish, enumeration of objects works in fundementally similar ways. Objects are segmented, then contiguous pixels are considered to be single objects.
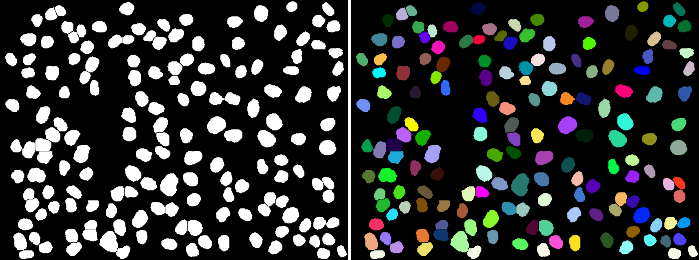
Nuclei are just one example of objects that can be counted automatically.
These objects can then be analysed for area, shape, intensity or any number of other features. They can even be used as a mask with which to measure a different channel or timepoint.
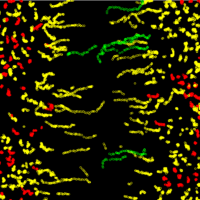
Tracking
Life exists in the temporal dimension. As such it's often scientifically interesting to follow objects over time. Maybe this is in order to track the changes in intensity or shape over time, but perhaps the movement itself is of interest to you?
All manner of imaging is amenable to tracking, including (as above) transmitted light.
At the CCI we can teach you how to track objects in two or three spatial dimensions over time and acrue dynamic data about your system. We have lots of experience working with tracking data so we can help you ask and answer the right questions.
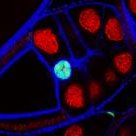
Colocalisation
When objects share spatial localisation, it is often suggestive of a meaningful interaction. There are many ways to biophysically assess interactions (for example using FRET) but sometimes a simple localisation can help to inform these descisions. Both pixel-based and object based colocalisation are useful tools depending upon the sample.

How much of your probe overlaps? What are the mean distances between neighbours?
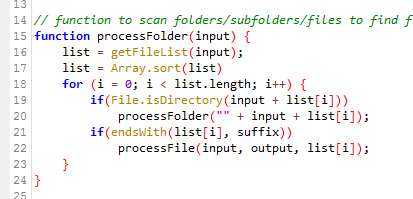
Workflow Automation
Even the most trivial of manipulations such as contrast adjustments or cropping can be laborious when applied to hundreds or thousands of images. Many software packages can be automated via scripting or macros which can turn a 5-day job into a 5-minute job. If you find yourself repeatedly doing the same task over and over again, come and talk to us about automation. You (or your students!) will be glad you did!
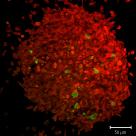
Visualisation
As research scientists, we all need to communicate our findings, whether to the public, peers, funding bodies or PhD examination committees to name but a few. A good figure can help explain a highly complex subject or clarify a technique. Visualising your data can also help you to interpret your findings and spot problems or subtle events.
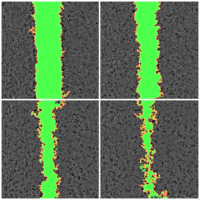

Some examples of visualising various types of data.
We also have available a Zegami server for the dynamic visualisation and querying of image datasets. You can access the public datasets here.

Software
Fiji
Fiji is a powerful, cross platform, extensible image processing program based on ImageJ. Plugins for common tasks such as registration, tracking and stitching come bundled, with lots of functionality available by adding more plugins. Through the Bio-Formats plugin, Fiji can pretty much open any proprietary microscopy formats that you throw at it. There is also great community support for Image Analysis and development questions.
Fiji is free to download and use.
Imaris
Imaris is a high-end image data visualisation, segmentation and analysis software. It's particular strengths lie in segmentation of spots and volumes and the subsequent tracking of those objects over time.
The CCI has licences on two of its workstations. Access is free to users of the facilty and can be arranged (for a fee) for non-users.
MATLAB
MATLAB is "the language of technical computing", and has many proven applications for Image Analysis. We find it particularly useful for FRAP analysis and for handling large tracking datasets where matrix mathematics become invaluable. The online reference documentation and community are fantastic resources for those using MATLAB and there is a great getting started tutorial.
MATLAB is installed on all of our workstations, and is available to University of Liverpool Staff and Students via the MWS.
OMERO
The Open Microscopy Environment (OME) is an open-source software framework designed for managing and analyzing biological imaging data. One of the key components of OME is OMERO (Open Microscopy Environment Remote Objects), a client-server software platform for managing, visualizing, and sharing microscopy images and metadata.
The server hosts microscopy image data and metadata, allowing users to access and interact with their data remotely using OMERO client software. There are multiple reasons to consider using OMERO:
Data Management: Centralized and organized repository for storing microscopy image data and associated metadata. It allows managing large volumes of image data efficiently and securely.
Collaboration: Seamless collaboration among researchers by allowing multiple users to access and work with the same datasets simultaneously. Users can share data, annotations, and analysis results with collaborators, fostering teamwork and knowledge sharing.
Data Visualization: Powerful visualization tools that allow users to view, annotate, and analyze microscopy images in various formats. It supports multi-dimensional data, including 3D and time-lapse images, and provides interactive visualization capabilities for exploring complex datasets.
Data Sharing: Easy sharing of microscopy image datasets with others, both within and outside your organization. You can control access permissions to ensure data security while still facilitating data sharing and collaboration.
Integration: Seamless integration with other software tools and platforms commonly used in biological imaging research including Fiji (ImageJ), KNIME, Icy, QuPath & MATLAB. It supports standard file formats and metadata standards, making it compatible with a wide range of microscopy equipment and analysis workflows.
Public Data Sharing: Option to make datasets publicly available, allowing researchers to share their data with the broader scientific community. This promotes transparency, reproducibility, and open science principles by making valuable research data accessible to others for further analysis and exploration. See here for the publicly shared data sets generated within the CCI.
Overall, an OMERO server provides a robust and flexible solution for managing, analyzing, and sharing microscopy image data, making it an invaluable tool for researchers in the life sciences. OMERO is accessible via a web browser or via a downloadable client which is installed on all of the acquisition systems and workstations in the CCI.
Image Analysis Suite
The Image Analysis Suite in the CCI comprises several desktop computers that have a range of specialist software installed which are maintained by the Technical Specialist in Image Analysis.
The workstations can be booked through the same booking system as the microscopes, BookIt-lab. You can view the schedule at:
https://srf.liverpool.ac.uk/Login
(login required to make bookings)
© Liverpool Centre for Cell Imaging